

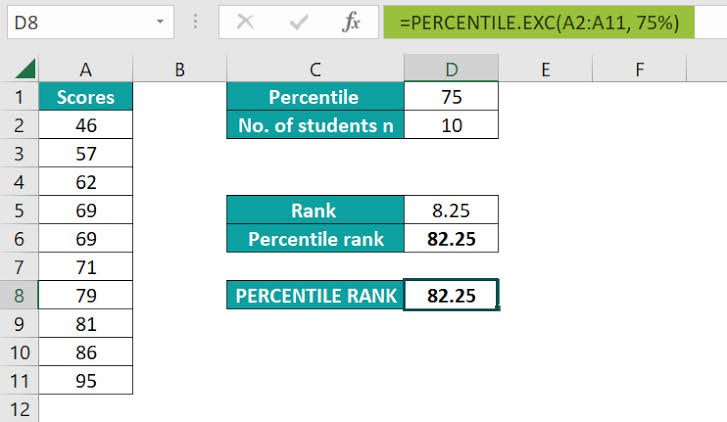
Understanding percentile rankings is important when comparing values within a dataset. Instead of simply knowing whether a score is high or low, percentile rankings show how a value performs relative to all other values in the same group. This makes data interpretation easier for teachers, business analysts, researchers, and spreadsheet users working with performance measurements and statistical reports.
The phrase percentile rank google sheets refers to using Google Sheets formulas to calculate these rankings automatically. Rather than performing manual calculations, users can rely on built-in spreadsheet functions to generate quick and accurate results. This saves time, improves reporting accuracy, and makes advanced data analysis available to users with every level of spreadsheet experience.
How the PERCENTRANK Function Works in Google Sheets
The PERCENTRANK function is designed to determine the percentage of values in a dataset that are equal to or lower than a selected value. The result is returned as a decimal number ranging between zero and one. When formatted as a percentage, the output becomes easier to understand and apply in practical situations.
The basic formula structure is simple and requires only the dataset and the target value. A common example is =PERCENTRANK(A2:A20,A2), which compares the value in cell A2 with all values in the selected range. Because of its flexibility, percentile rank google sheets calculations can be performed across small lists or very large databases.
How to Calculate Percentile Rankings Step by Step
The first step in calculating percentile rankings is organizing your data into a clean column or row without unnecessary text or empty spaces. Once the values are arranged, choose a blank cell where you want the percentile result to appear and enter the PERCENTRANK formula using the appropriate cell references.
After entering the formula, press Enter and Google Sheets instantly generates the result. If you need percentile values for an entire dataset, simply drag the formula downward to copy it to additional rows. This method makes percentile rank google sheets calculations efficient and practical for ongoing reporting and business analysis projects.
Understanding the Difference Between PERCENTRANK and PERCENTILE
Many users confuse PERCENTRANK with PERCENTILE because both functions involve percentages and statistical analysis. However, they serve different purposes within Google Sheets. PERCENTRANK identifies the ranking position of a value within a dataset, while PERCENTILE returns the value located at a specific percentile position.
For example, PERCENTRANK can show that a student scored higher than eighty percent of the class, while PERCENTILE can identify the score needed to reach the eightieth percentile. Understanding this distinction helps users choose the right formula and improves the accuracy of percentile rank google sheets reporting.
Exploring PERCENTRANK.INC and PERCENTRANK.EXC
Google Sheets includes additional variations of the main formula called PERCENTRANK.INC and PERCENTRANK.EXC. The inclusive version includes the lowest and highest values in the calculations, making it suitable for general business and educational use. Most spreadsheet users rely on this method because it produces familiar and easy-to-understand results.
The exclusive version removes the smallest and largest values from the ranking calculation. This approach is sometimes preferred in specialized statistical environments where strict percentile definitions are required. Knowing when to use these variations can significantly improve the reliability of percentile rank google sheets analysis for professional reporting.
Common Mistakes When Using Percentile Functions
One of the most common errors occurs when users include blank cells, text values, or incorrect ranges within the formula. Since percentile calculations rely entirely on numerical values, mixed data types can produce unexpected results or generate formula errors that affect the overall analysis process.
Another issue appears when formulas are copied down a column without locking the original data range using absolute references. This causes the comparison range to shift with every row, resulting in inconsistent outputs. Avoiding these mistakes helps ensure that percentile rank google sheets calculations remain accurate and trustworthy.
Practical Applications of Percentile Rankings
Educational institutions frequently use percentile rankings to compare examination results and determine student performance levels. Teachers can identify high-performing students, evaluate class distributions, and understand learning trends more effectively by using automated spreadsheet calculations rather than manual statistical methods.
Businesses also benefit from percentile analysis when measuring employee productivity, sales performance, customer feedback, and operational efficiency. The ability to compare values against an entire dataset allows managers to make informed decisions based on meaningful insights generated through percentile rank google sheets techniques.
Using Percentile Rankings with Large Datasets
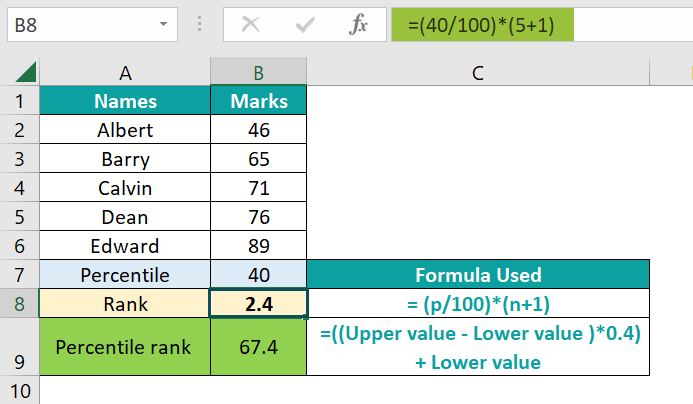
Large datasets often contain hundreds or even thousands of records, making manual analysis impossible. Fortunately, Google Sheets allows formulas to scale efficiently across extensive databases while maintaining fast performance and reliable calculations. This capability makes percentile analysis useful for growing organizations and research teams.
Users can further improve efficiency by combining percentile functions with sorting, filtering, and conditional formatting tools. Highlighting top performers or identifying lower-performing values becomes significantly easier with visual indicators. As a result, percentile rank google sheets becomes an essential component of advanced spreadsheet dashboards and reports.
Advanced Tips for Better Data Analysis
Experienced spreadsheet users often combine percentile formulas with IF statements and ARRAYFORMULA functions to create dynamic reports. These techniques automatically update rankings whenever new data is entered, reducing maintenance requirements and improving workflow efficiency for recurring business reports.
Another useful strategy involves integrating percentile calculations into performance dashboards and management scorecards. Visualizing rankings alongside charts and key metrics allows decision makers to understand trends quickly. These advanced methods demonstrate the full analytical power available through percentile rank google sheets functions.
Conclusion
Google Sheets offers powerful tools for transforming raw numbers into meaningful information, and percentile functions are among the most useful options available. Whether analyzing student scores, business performance, or research findings, percentile rankings provide valuable context that simple averages often fail to capture.
Learning how to use percentile rank google sheets effectively can improve decision making, strengthen reports, and simplify statistical analysis. By mastering the PERCENTRANK formula and its related functions, users gain the ability to interpret data with greater confidence and produce more valuable insights from everyday spreadsheets.
FAQs
What does the PERCENTRANK function do in Google Sheets?
The PERCENTRANK function calculates the relative position of a value within a dataset and returns its ranking as a percentage or decimal value.
What is the difference between PERCENTRANK and PERCENTILE?
PERCENTRANK identifies how a value compares to others, while PERCENTILE finds the value associated with a specific percentile position.
Can I calculate percentile rankings for an entire column?
Yes, you can apply the formula to one cell and drag it downward to generate percentile rankings for every value in the dataset.
Should I use PERCENTRANK.INC or PERCENTRANK.EXC?
Most users prefer PERCENTRANK.INC because it includes the minimum and maximum values in the dataset calculations.
Why is my percentile formula showing an error?
Formula errors usually occur because of invalid cell ranges, non-numeric values, or incorrect references within the selected dataset.
You May Also Read: Rank Google Sheets